[ BEYOND THE ROOM · RESEARCH ]
Hotel Non-Room Revenue: Sizing the $27.3 Billion Destination Commerce Opportunity
Beyond the Room research, Drop 2 · By Philip Beck
U.S. hotels could transact an estimated $27.3 billion a year in sales beyond rooms and ordinary food and beverage, according to new DestinationCommerce modeling. The opportunity comes from three sources: assets hotels already own, offerings hotels create, and local businesses they recommend. It is heavily concentrated: about 14,000 upper-tier properties, 22% of U.S. hotels, hold three-quarters of it.
We call this opportunity destination commerce. This page sets out what we found, who would earn from it, and how we built the estimate.
Key findings
- $27.3B: estimated mature annual U.S. destination commerce opportunity (gross marketplace value).
- Three engines: $9.8B from hotel-controlled assets, $10.3B from hotel-created offerings, $7.2B from third-party local commerce.
- 22% → 75%: full-service, luxury/lifestyle and resort hotels account for ~$20.6B.
- $12.4B stays with hotels, and $10.6B goes to independent local businesses.
- Conservative by design: the model assumes hotels put only 2.5–3.7% of their existing non-room revenue through a marketplace, and counts no benefit to room revenue, occupancy or RevPAR.
All figures are DropDesk model estimates of mature annual gross marketplace value, not forecasts.
The context: a $249 billion gap
Hotel room revenue has limits: a fixed number of rooms, sold at market rates. What guests spend beyond the room is larger. Our analysis of Oxford Economics data shows that for every $100 U.S. hotel guests spend on lodging, they spend about $106 more off-property on dining, recreation, retail and other goods and services, before transportation. That totals $249.1 billion a year.
That figure measures the wider guest economy, not what hotels could realistically capture. So we built a separate, much narrower estimate of what hotels could transact through their own branded marketplace. The result is $27.3 billion, about 3.5% of total U.S. hotel guest spending.
Three engines of destination commerce
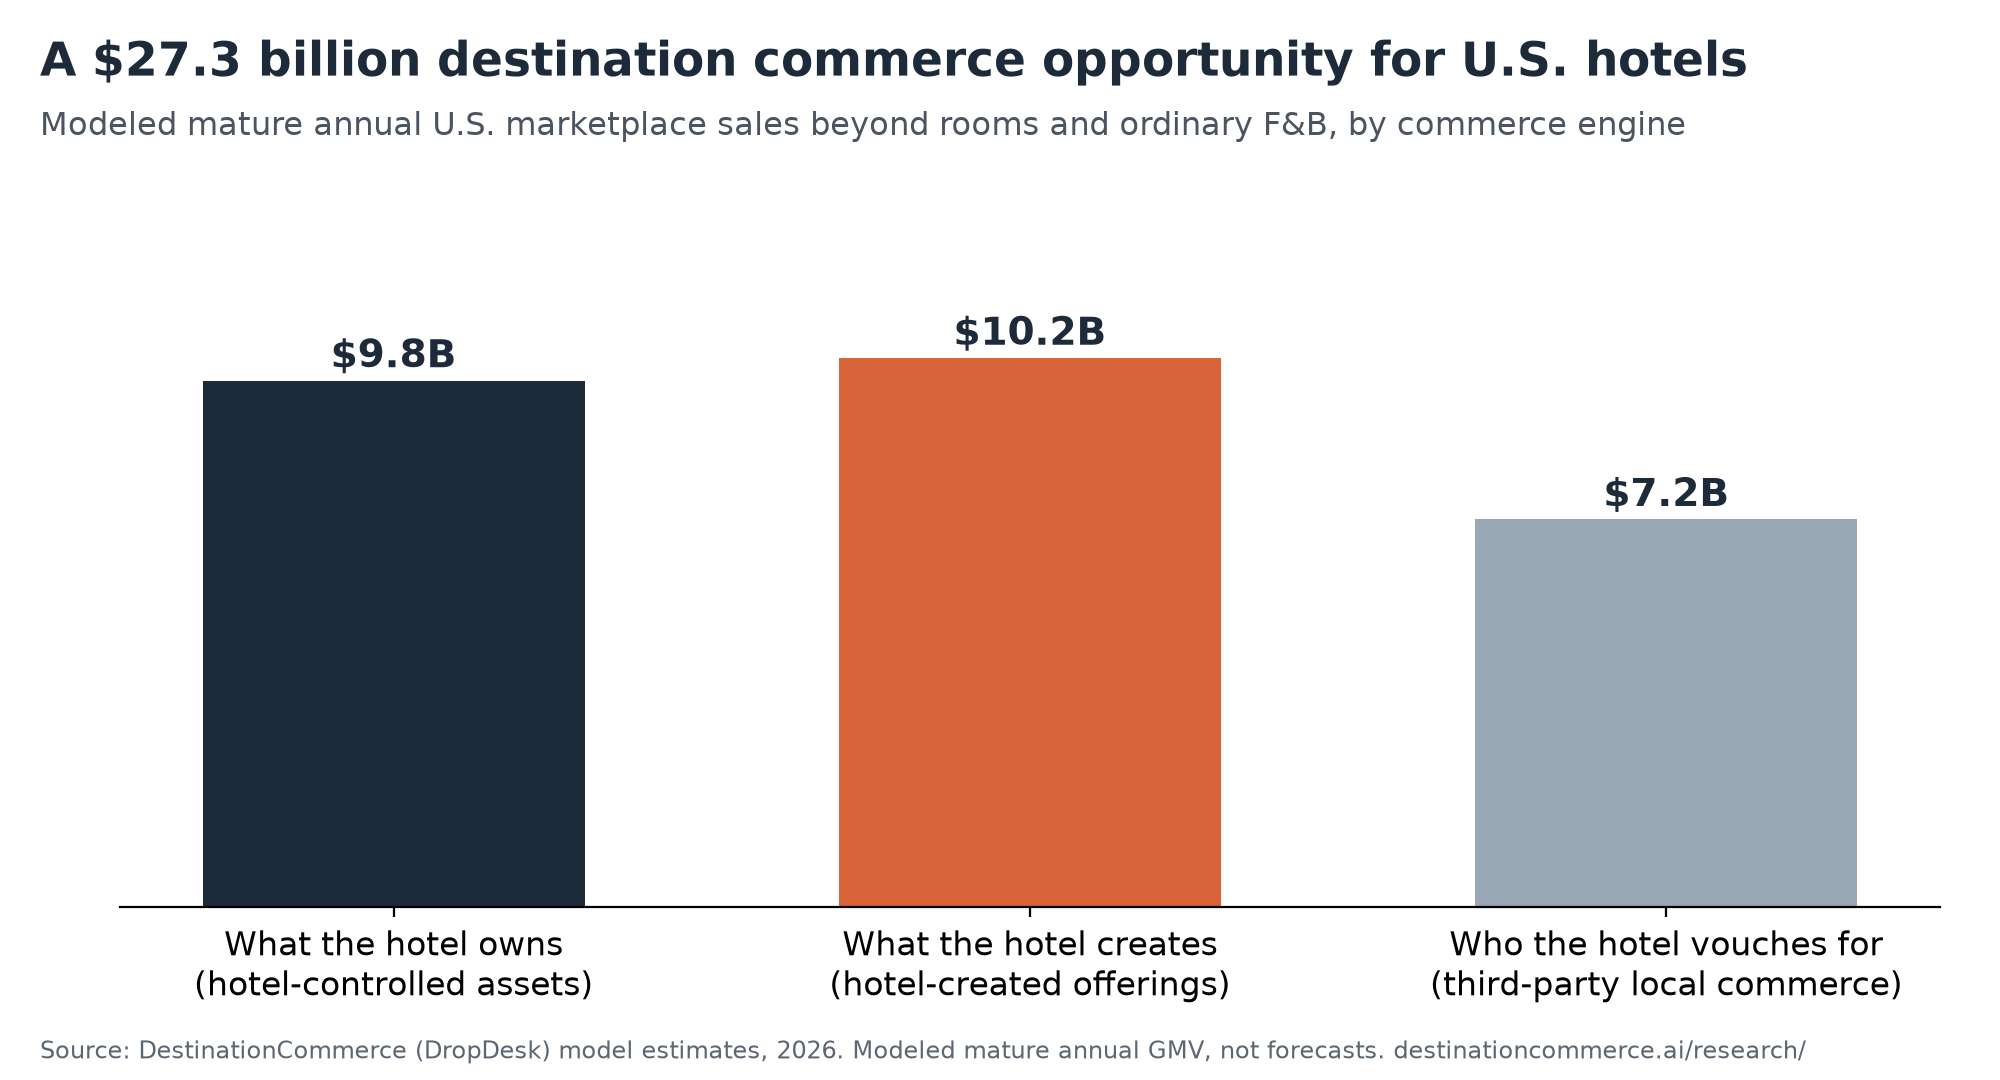
1. What the hotel owns: $9.8B
Hotel-controlled assets: physical inventory beyond guestrooms that sits empty for much of the day. Examples include meeting and event space outside peak periods, pools and cabanas, parking, day-use rooms, rooftops, outdoor space, workspace and wellness facilities.
These assets already exist and their costs are already covered. Many of them aren't sold online. When they are, they're usually sold only to overnight guests. Opening them to local residents, businesses and day visitors, as well as guests, is the fastest way for a hotel to add revenue, and the hotel keeps nearly all of it.
2. What the hotel creates: $10.3B
Hotel-created offerings: packages, programs and experiences built from the hotel's own services, spaces and staff, sometimes combined with outside partners. Examples include chef's tables, wellness programs, family itineraries, cultural programs, childcare, seasonal packages and premium guest services.
Other channels can't copy these, because only this hotel offers them. That makes them the engine most likely to differentiate a hotel when a guest is choosing where to book.
3. Who the hotel vouches for: $7.2B
Third-party local commerce: bookings with independent businesses the hotel trusts and recommends. Examples include tour operators, restaurants, transport providers, guides, photographers, attractions and wellness practitioners.
Concierges have made these recommendations for a century. In a destination commerce model, the recommendation becomes a booking through the hotel's marketplace. The local business gets the customer, the hotel shares in the revenue, and the guest books through someone they trust.
Selling spa appointments online is ancillary revenue. Recommending a restaurant is concierge service. Making the spa, the chef's table and the restaurant all bookable in one place, under the hotel's brand, with the hotel earning on each, is destination commerce.
22% of hotels hold 75% of the opportunity
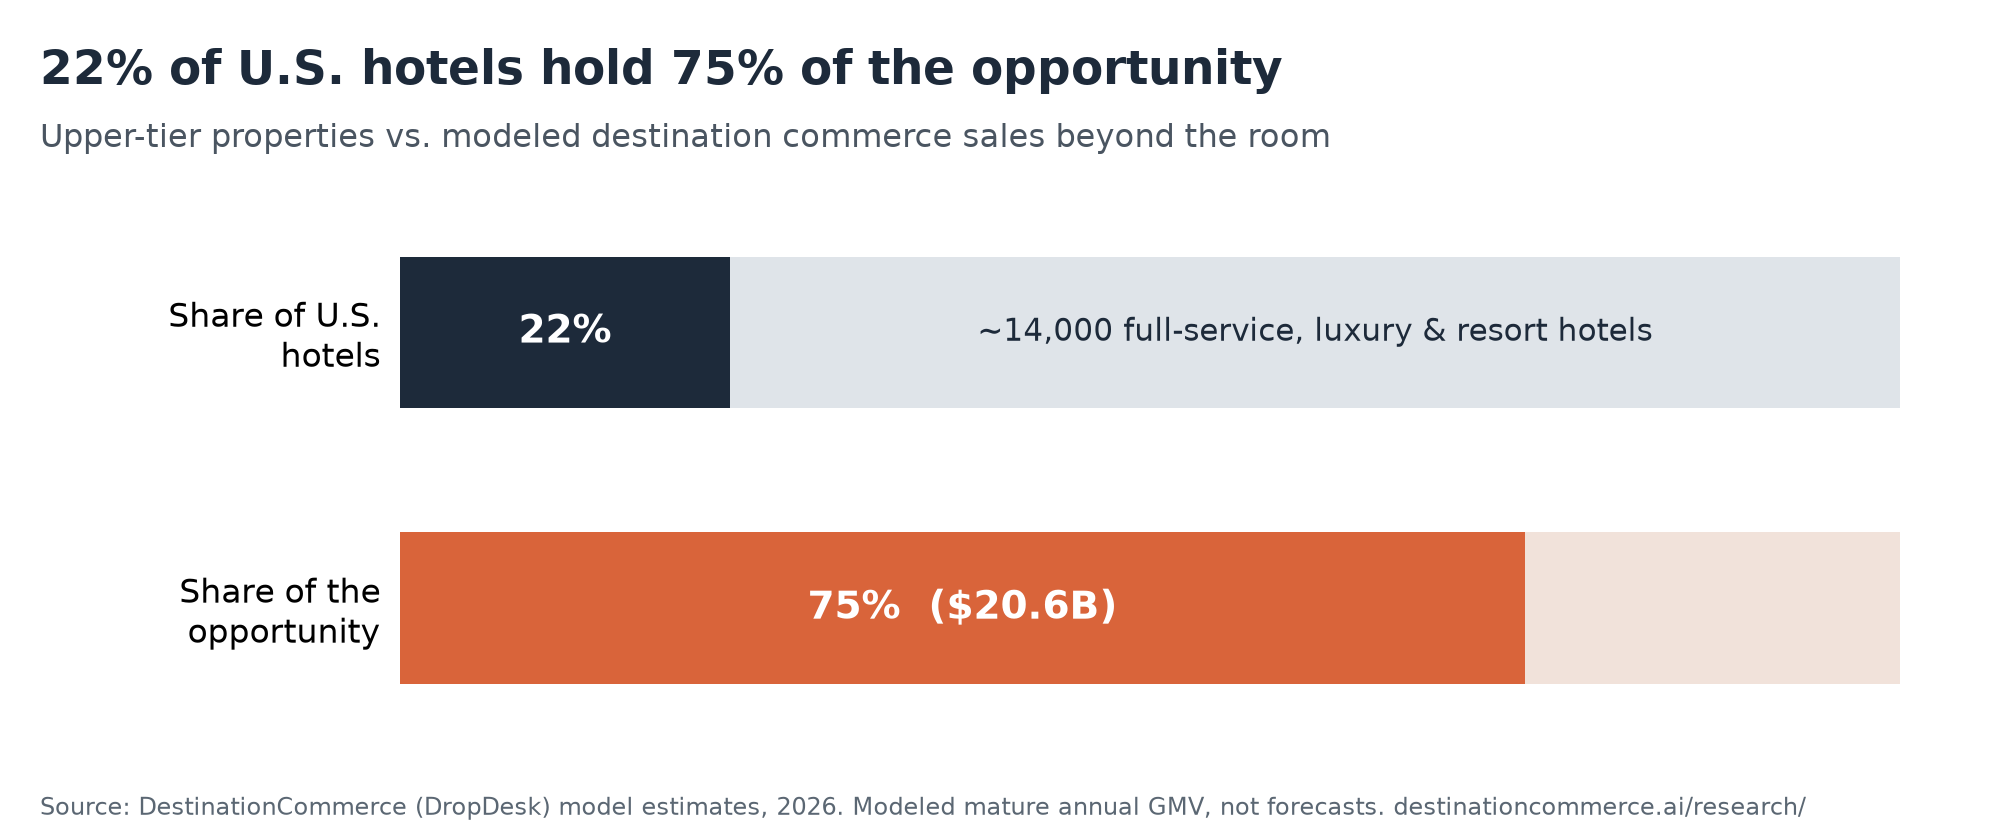
The opportunity is not spread evenly. About 14,000 full-service/upscale, luxury/lifestyle and destination resort/convention properties, roughly 22% of the 64,000+ U.S. hotels, account for about $20.6 billion, or 75% of the modeled value.
This follows from how those hotels operate. They have more space and amenities to sell, guests who spend more and stay longer, broader programming, and more local businesses nearby to partner with. Within this segment, hotels would retain an estimated $9.7 billion a year directly.
Select-service and economy hotels still have an opportunity, particularly for parking, meeting space and curated local partners. For them it looks more like a centrally managed digital marketplace than a concierge-led one.
Who earns from destination commerce
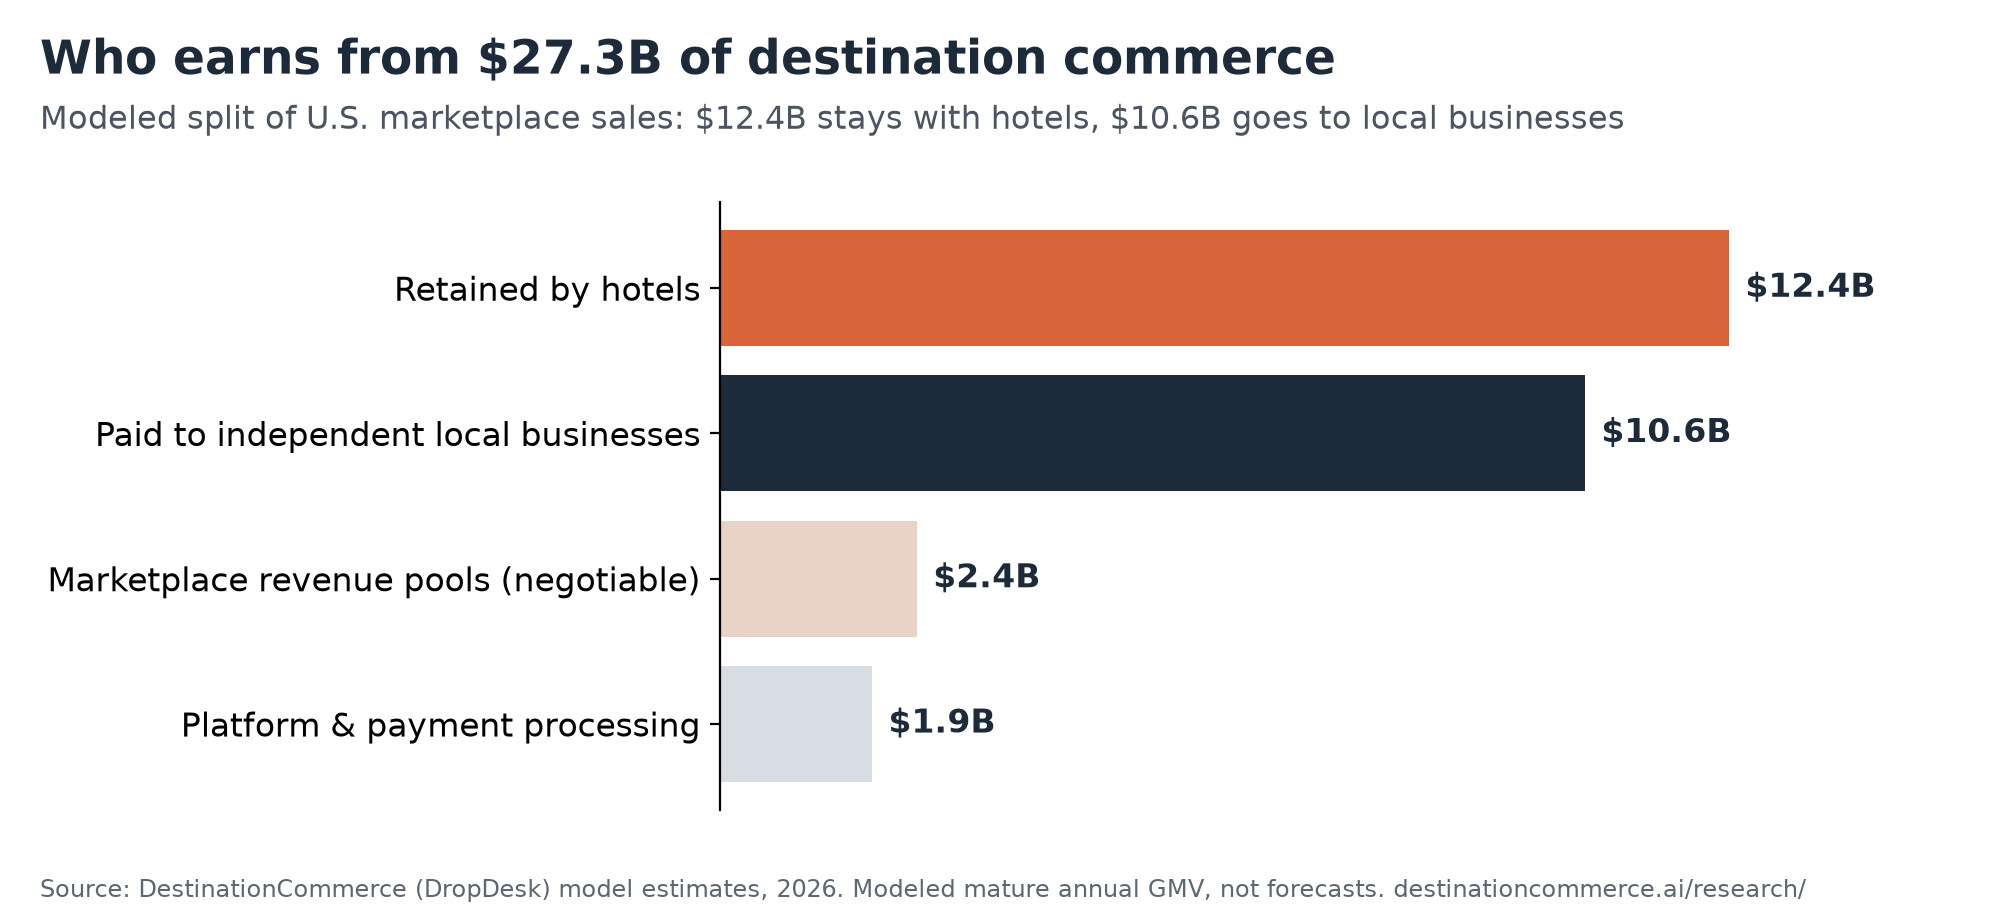
Destination commerce doesn't just move revenue from one party to another. Most of the value goes to hotels and to independent local businesses:
| Participant | Est. annual value | Share |
|---|---|---|
| Hotels (retained directly) | $12.4B | 45% |
| Independent local businesses | $10.6B | 39% |
| Marketplace revenue pools (negotiable between hotel and partners) | $2.4B | 9% |
| Platform fees and payment processing | $1.9B | 7% |
| Total | $27.3B | 100% |
For local businesses, a hotel marketplace is a distribution channel that comes with a trusted recommendation. For hotels, the revenue they keep directly adds to profit dollar for dollar, if the marketplace can be run without significant extra cost at the property. That's our modeling assumption, and it needs to be validated in real deployments.
What's not in the number
We left out three things that could make the opportunity larger:
- Room revenue effects. If offerings shown at the time of booking help a hotel win the reservation, or support a higher rate or repeat stays, that value is additional. Research on guest satisfaction and online reputation suggests a plausible link between better guest experiences and hotel pricing power. It shows association, not proven cause, so we count none of it.
- Hotel shares of the negotiable revenue pools ($2.4B). Hotels may negotiate a share, but we don't assume they will.
- Non-U.S. hotels. The model covers the United States only.
Methodology
Approach. We built a bottom-up model of the U.S. hotel market segmented into five property tiers, from economy/limited-service to destination resort/convention, totaling roughly 64,000 properties. For each tier we estimated annual gross marketplace value separately for each of the three commerce engines, then added them up to reach a national total.
- Hotel-controlled assets were modeled from the monetizable inventory typical of each tier, including meeting and event space, parking, wellness, recreation, day-use and workspace. These estimates were then tested two ways:
- Top-down, against hotel operating economics and non-room revenue. The asset estimates are equivalent to only 2.5–3.7% of modeled non-room revenue at full-service, luxury and resort properties.
- Bottom-up, against identifiable hotel-controlled revenue and inventory. The independent estimate supported our full-service assumption and came in above our luxury and resort assumptions, which suggests those are conservative.
- Hotel-created offerings and third-party commerce were modeled from occupied room nights, the share of guests who see the marketplace, purchase conversion, purchase frequency and average transaction value, with assumptions set separately for each tier. Conversion assumptions are informed by published travel-commerce benchmarks.
- Reasonableness checks used STR/CoStar food-and-beverage benchmarks and CBRE hotel operating research.
- Industry denominators (properties, rooms, room nights, guest spending) come from Oxford Economics for AHLA.
What the figures are. Modeled mature annual opportunity: what the market could look like once marketplaces are established. They are not forecasts of adoption or revenue in any given year, and they exclude any room-revenue benefit.
Limitations. Asset inventories, conversion rates, transaction values, activation rates and time to maturity all need to be validated with operating data from real hotel deployments. We'll update the model as that data comes in.
Detailed assumptions available on request. Per-tier inputs and worked property examples are available to journalists, analysts and hotel operators on request, under embargo or on background. Contact hello@destinationcommerce.ai.
FAQ
- How much non-room revenue could U.S. hotels generate?
- DestinationCommerce estimates U.S. hotels could transact $27.3 billion a year beyond rooms and ordinary food and beverage through branded marketplaces. Hotels would retain about $12.4 billion of that directly.
- Which hotels have the biggest non-room revenue opportunity?
- Full-service, luxury/lifestyle and resort hotels. About 14,000 properties, 22% of U.S. hotels, account for roughly 75% of the modeled opportunity, because they have more sellable assets, guests who spend more, and broader programming.
- What are examples of hotel non-room revenue?
- Meeting and event space, parking, pool and cabana rentals, day-use rooms, spa and wellness, rooftop and outdoor space, hotel-designed packages and experiences, and commission-sharing bookings with local tour operators, restaurants and service providers.
- Is this the same as hotel ancillary revenue?
- It overlaps but is broader. Ancillary revenue usually means extra services a hotel sells to its own guests. Destination commerce also includes selling hotel assets to non-guests and bookings with independent local businesses, all through one hotel-branded marketplace. See our guide to hotel ancillary revenue.
Sources. Oxford Economics for AHLA, Economic Impact of the U.S. Hotel Industry (Jan 2025, 2024 data); STR data via CoStar News (Aug 2025); CBRE Hotels Research, Trends in the Hotel Industry; DestinationCommerce (DropDesk), Destination Commerce white paper v3.3 (Sep 2026).
Use this research. Charts are free to embed with a credit link. Media contact: hello@destinationcommerce.ai · Philip Beck is available for interview.
Cite: DestinationCommerce (DropDesk), "Hotel Non-Room Revenue: Sizing the $27.3 Billion Destination Commerce Opportunity," Beyond the Room, 2026. https://destinationcommerce.ai/research/hotel-non-room-revenue/